DMAIC Tools for the Analyze Phase: A Simple Guide to Finding the Root Cause
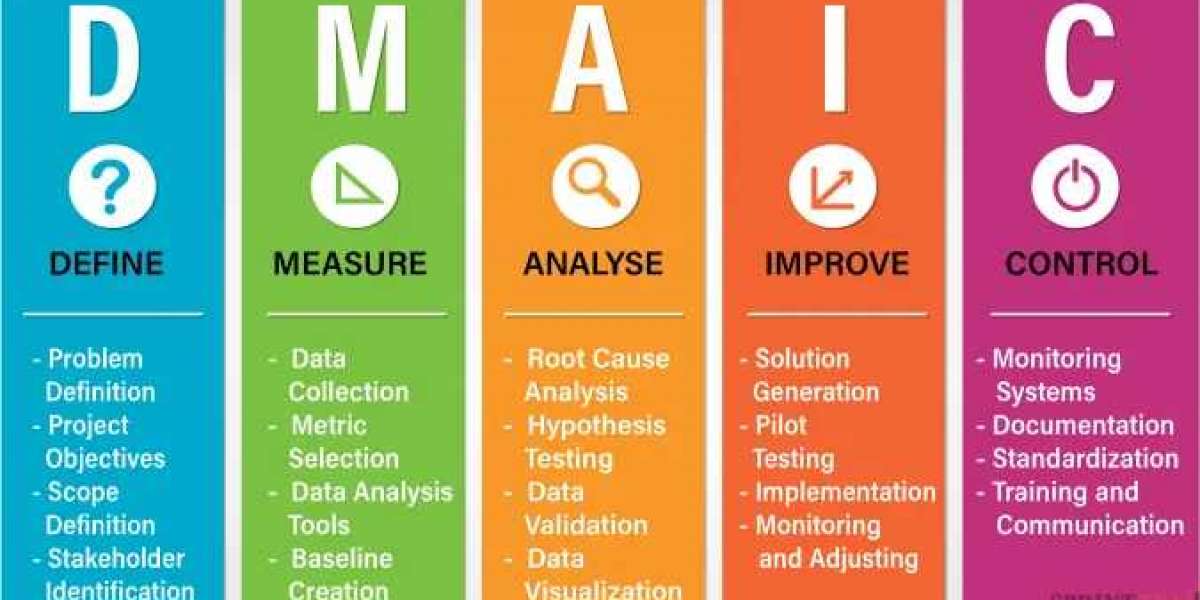
The Analyze phase in the DMAIC (Define, Measure, Analyze, Improve, Control) methodology is all about uncovering the root causes of a problem. This phase helps you understand why issues are happening so you can fix them effectively. To do this, different tools are used to analyze the data and provide clarity on the issues at hand. Let’s dive into some popular DMAIC tools that help during the Analyze phase:
1. Cause-and-Effect Diagram (Fishbone Diagram)
- What is it? This tool is shaped like a fishbone, with the problem at the head and different causes branching out like bones.
- How it helps: It helps teams brainstorm and find the root causes of a problem by breaking it down into categories. It’s a great way to collaborate and organize ideas visually.
2. Pareto Chart
- What is it? A Pareto chart is a bar chart that shows which causes have the biggest impact on a problem. It follows the 80/20 rule, meaning a small number of causes usually lead to most of the issues.
- How it helps: It helps you focus on the most important problems by prioritizing them. This makes it easier to know where to focus your efforts.
3. Hypothesis Testing
- What is it? This method uses statistical tests to check if certain causes are really behind a problem. Common tests include t-tests and chi-square tests.
- How it helps: It helps validate whether your ideas about the cause of the problem are backed by data. This ensures your decisions are based on solid evidence.
4. Scatter Plot
- What is it? A scatter plot is a graph that shows how two things are related. Each point represents a data point, helping you see patterns or trends.
- How it helps: It helps you visualize relationships between different factors, which can reveal patterns or show that two things are linked.
5. Five Whys Analysis
- What is it? This technique involves asking “Why?” five times (or more) to dig deeper into the root cause of a problem.
- How it helps: It’s a simple yet effective way to go beyond surface issues and get to the heart of the problem. It helps you understand the real reasons behind a situation.
Each of these tools can be a game-changer when trying to analyze a problem and find the root cause. They make the process more organized and help you see things more clearly.
To learn more about DMAIC tools for the Analyze phase, check out this helpful blog from Sprintzeal. It goes into more detail and provides even more tips to improve your process.
#Education #business